Archive
Radio NZ: Politics with Matthew Hooton and Mike Williams – 27 May 2014
.
– Politics on Nine To Noon –
.
– Monday 27 May 2014 –
.
– Kathryn Ryan, with Matthew Hooton & Mike Williams –
.
Today on Politics on Nine To Noon,
Our political commentators speak about the recent boost in National’s polling, the strengthening New Zealand economy, and the upcoming elections.
.
![]()
.
Click to Listen: Politics with Matthew Hooton and Mike Williams (21′ 30″ )
- Budget 2014, Family Package
- Polls
- Election 2014, voting, Labour-Green Bloc, “Missing Million” voters
- David Shearer
- Environment, rivers, genetic engineering, nitrate pollution, Ruataniwha Dam
- Resource Management Act reforms, Amy Adams, Peter Dunne
- Mana Party, Internet Party
- Green Party list
- Winston Peters, Parliament
.
= fs =
Budget 2014 – Why we will soon owe $70 billion under this government…
.

Graphic courtesy of The Daily Blog
.
A few reasons why our debt skyrocketed from 2008 onwards…
1. The Global Financial Crisis, which reduced corporate turnover and export receipts, thereby lowering the company tax take;
2. Two tax cuts (2009 and 2010) reduced government revenue, thereby necessitating borrowing more from offshore to make up the difference. In essence, we borrowed from other peoples’ saving to put more money in our (mostly top incomer earners) pockets.
Using Parliament Library information, the Greens have estimated that this involved borrowing an extra couple of billion each year.
3. National could have kept Debt down by investing in job creation. Key’s cycleway project was promised to create 4,500 new jobs – it failed spectacularly.
Instead, job creation was largely left to “the market”, which itself was having to engage in mass redundancies for businesses to survive the economic downturn.
This meant more expenditure on unemployed which went from 3.4% in 2008 to 7.3% by 2012 (currently sitting at 6% for the last two Quarters).
Ironically, part of our current economic “boom” is predicated on the Christchurch re-build – evidence that had National engaged in a mass housing construction programme in 2009, after it held it’s mostly ineffectual “Jobs Summit”, we would have;
A. Maintained higher employment,
B. Paid out less in welfare,
C. Persuaded more New Zealanders to stay home and not go to Australia to find work,
D. Addressed the current housing crisis we now have.
As usual, National’s short-sightedness; irresponsible 2008 election year tax-cut bribes; and misguided reliance on market forces resulted in New Zealand borrowing more than we really needed to.
.
References
NZ Herald: Govt borrowing $380m a week
Scoop media: Govt’s 2010 tax cuts costing $2 billion and counting
NZ Parliament: Government Proposals—Cycleway and Nine-day Working Fortnight
NZ Herald: Cycleway jobs fall short
Statistics NZ: Employment and Unemployment – March 2008 Quarter
Statistics NZ: Household Labour Force Survey: September 2012 quarter
Fairfax NZ: Jobs summit ‘fails to deliver’
TVNZ News: OECD report shows housing crisis in NZ – Labour
TVNZ News: Christchurch rental crisis ‘best left to market’ – Govt
Additional
Fairfax media: Public debt climbs by $27m a day
Fairfax media: Budget 2014: The essential guide
Previous related blogposts
Can we do it? Bloody oath we can!
.

Above image acknowledgment: Francis Owen/Lurch Left Memes
.
.
= fs =
Budget 2014 – What deceits lie in this document?
.

.
Looking through the on-line Budget document on Treasury’s website, I happened to notice something… peculiar.
The following page is entitled Responsibly managing the Government’s finances and is part of Finance Minister Bill English’s summary. As such, it is a political document and not a Treasury report.
.

.
Note the five graphs on this page. Notice anything about them?
Any… inconsistencies?
Let me “lump” them together, so they can be better compared;
.

.
Note the starting dates on each graph. They differ in nearly each case;
- 2012/13
- 2006/07
- 2009/2010
- 2004
- 2004
At first glance, there appears no reason for the difference start-dates of each graph.
That is, until you look at what each graph represents.
Graphs number 2, 4, and five show the previous Labour government in an unfavourable fiscal light.
#2: Shows “Core Crown Revenue” falling from 2006, and “Core Crown Expenses” rising from around the same time.
#4: Shows “Budget Operating Allowances” much higher under Labour – highlighted by the use of red and blue column lines – than National. The 2008 red-bar is erroneous.
#5: Shows “90 Day Interest Rates” higher under Labour than National – again highlighted by the use of red and blue graph lines.
Meanwhile, graphs 1 and 3 show National in a more positive position;
#1: Shows “Total Crown operating balance before gains and losses (OBEGAL)” starting from 2012/13, and reducing. There is no prior context depicted for any previous years. The overall impression is a favourable one to the viewer.
#3: Shows “Net Core Crown Debt” rising from 2009; peaking at 2013/14; and dropping thereafter. Again, there is no prior context depicted for any previous years.
If we replace the mis-leading charts with more accurate representations, the picture is unsurprisingly different. A verticle red line on the right hand, accurate graph, pinpoints where Bill English’s graph (on the left) starts.
1. Total Crown operating balance before gains and losses (OBEGAL)
.

Bill English’s misleading version on left; More accurate version on right.
.
The more accurate version on the right gives a more complete picture of successive government’s Total Crown operating balance before gains and losses (OBEGAL), and put’s National’s record in context.
2. Core Crown revenue and expenses
.
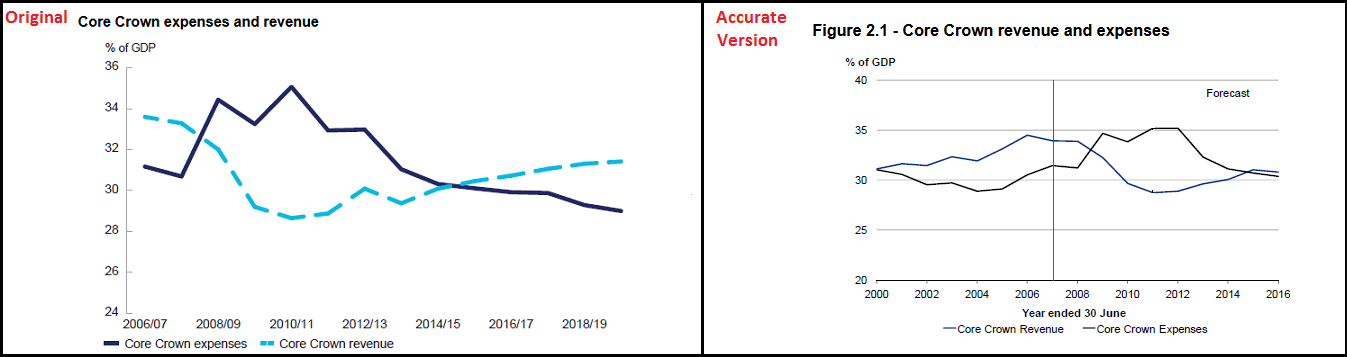
Bill English’s misleading version on left; More accurate version on right.
.
The more accurate version on the right gives a more complete picture of successive government’s Core Crown revenue and expenses, and put’s National’s record in context.
This next one is a personal favourite of mine, and National/ACT supporters hate it with a passion.
3. Net core Crown debt
.
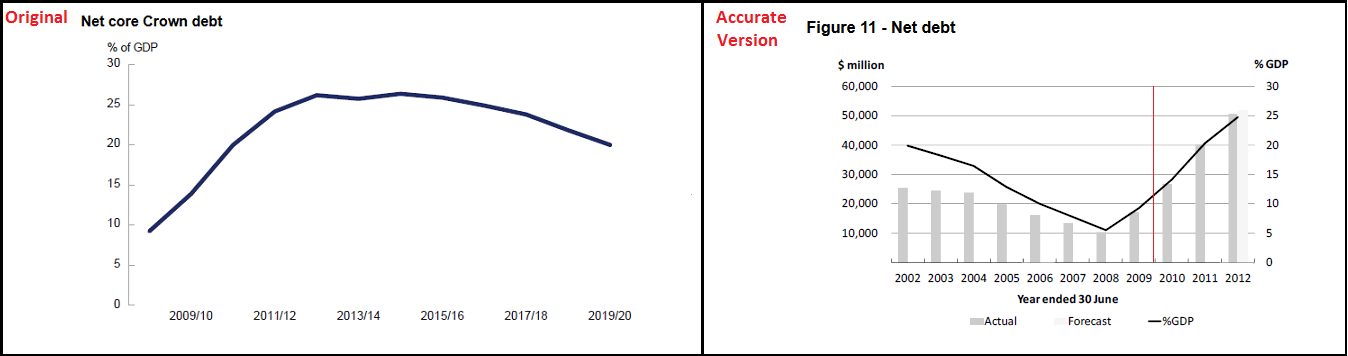
Bill English’s misleading version on left; More accurate version on right.
.
The more accurate version on the right gives a more complete picture of successive government’s Net core crown debt, and put’s National’s record in context. It also happens to highlight Labour’s track record in reducing the country’s sovereign debt – something that jars with Right Wing historical revisionism that attempts to depict Labour as an incompetent fiscal manager.
4. Budget operating allowances
.
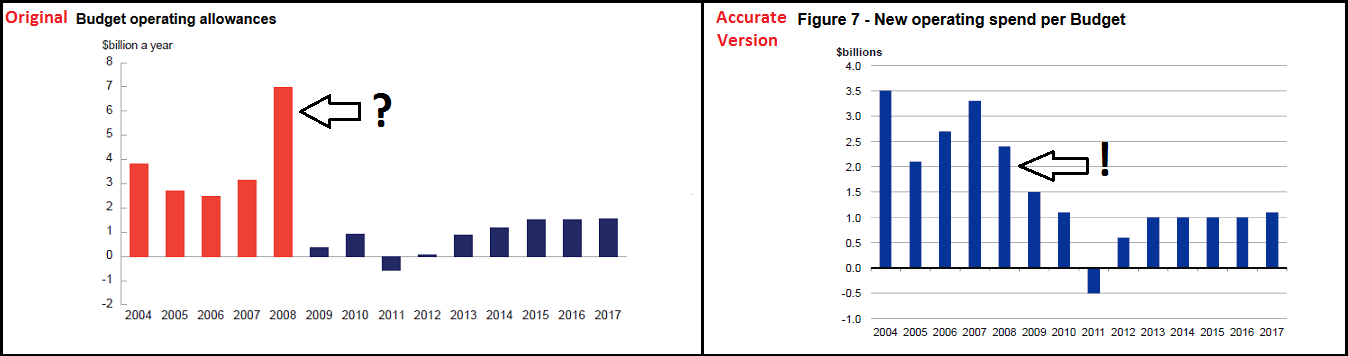
Bill English’s misleading version on left; More accurate version on right.
.
Whilst English’s graph (on the left) has a start point in 2004, it is highly inaccurate. Note the red bar for 2008, showing Labour having a Budget operating allowance of around $7 billion. This is false. As the blue bar on the graph on the right shows, the Budget operating allowance for 2008 was just under $2.5 billion – one third of what English’s chart depicts.
Note: the chart on the right, with the blue bars is taken from Budget 2013 – Bill English’s own document from last year. The correct data (blue graph) is supported by a 2010 Treasury working-paper, Fiscal Institutions in New Zealand and the Question of a Spending Cap.
Either the red bar for 2008 is an error – or a deliberate attempt to further portray the previous Labour government in a bad light. Considering that three out five graphs appear to have been selectively presented, the possibility that the 2008 red-bar was deliberately fudged cannot be excluded.
5. 90-day interest rates
.
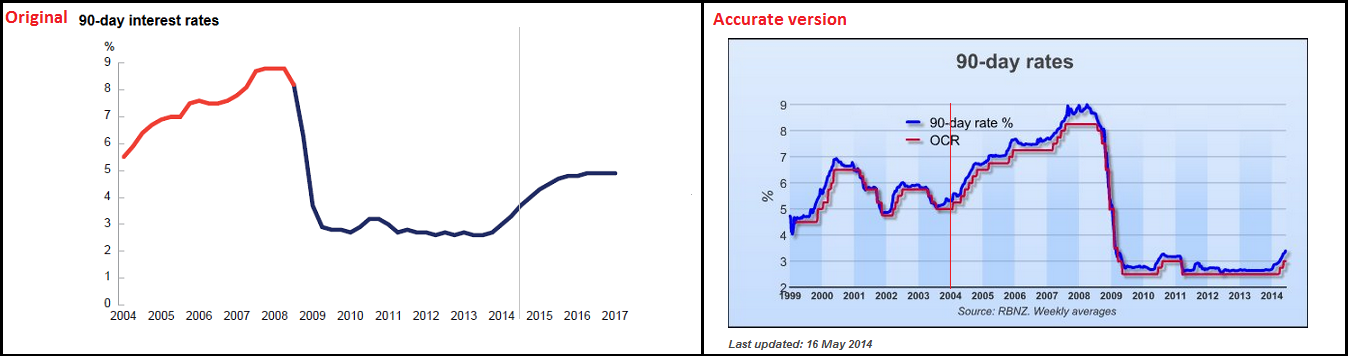
Bill English’s misleading version on left; More accurate version on right.
.
English writes that “Future Budget allowances are set at sustainable levels… [graph inserted] ...which is helping to take pressure off interest rates“.
Actually, the reason that the OCR and 90 Day Rates are currently at a historic low has little to do with “future budget allowances“. The Reserve Bank does not set current OCR/90 Day Bill Rates against “future” budget allowances.
Indeed, the RBNZ dropped the OCR to 2.5% in April 2009, the following year from recession hitting our economy.
There is next to no reason for English to have included the 90 Day Interest Rate in his Budget document, except to attempt to take credit for historically low interest rates that were the result of a global financial crisis and not because of any actions his government took in 2007/08.
Not unless he, John Key, and the rest of the National caucus were sitting in Board Rooms across Wall Street?
Not unless he, John Key, and the rest of the National Party were in government a full year before the 2008 general election?
And not unless Bill English also wants to also claim responsibility for high interest rates in the 1990s, when the National Party governed under the leadership of Jim Bolger, with finance ministers Ruth Richardson and Bill Birch? When interest rates peaked at over 15% in 1990 and were consistently high throughout the 1990s.
Unsurprisingly, this is one graph that did not find it’s way into Bill English’s 2014 Budget document;
.

.
As for Budget 2014 – I suspect it is a document that will soon reveal more hidden surprises for us all.
.
References
NZ Treasury: Budget 2014 – 1. Responsibly managing the Government’s finances
NZ Treasury: Operating Balance (2002-2011)
NZ Treasury: Core Crown revenue and expenses (2000-2014)
NZ Treasury: Net core Crown debt (2002-2012)
NZ Treasury: Operating Allowances
NZ Treasury: Fiscal Institutions in New Zealand and the Question of a Spending Cap
Reserve Bank NZ: 90-day rate
Reserve Bank NZ: Mortgage interest rates — since 1990
.
Above image acknowledgment: Francis Owen/Lurch Left Memes
This blogpost was first published on The Daily Blog on 19 May 2014.
.
.
= fs =
Radio NZ: Focus on Politics for 23 May 2014
.
– Focus on Politics –
.
– Friday 23 May 2014 –
.
– Brent Edwards –
.
A weekly analysis of significant political issues.
Friday after 6:30pm and Saturday at 5:10pm
Youth unemployment has decreased since the last election but that still leaves 75 thousand young people in New Zealand who are not doing any kind of work, training or education.
.
![]()
.
Click to listen: Focus on Politics for 23 May 2014 ( 17′ 5″ )
- Budget 2014, Paid Parental Leave, Free medical care for Under 13s
- Income inequality & child poverty
- Youth unemployment (NEETs)
- wage growth, jobs
- external deficit, exports, China, dairy industry, tourism
- housing, capital gains tax
- government surplus, research and science, innovation
- health spending, education spending, superannuation spending
- superannuation age of eligibility, Bill English
- tax cuts
.
.
.
= fs =
Budget 2014 – How has National exposed itself in Election Year?
.

.
Right Wing blogger and National Party apparatchik, David Farrar, wrote in the Dominion Post on the day after the Budget,
“By contrast I expect debate on the New Zealand Budget to be over by Monday morning.”
Really?!
Don’t you believe it, sunshine.
National’s sixth budget contained spending on;
- $171.8 million to extend paid parental leave (PPL):
- Additional four weeks, starting with a two-week extension from 1 April 2015, and another two weeks from 1 April 2016.
- Extend eligibility of paid parental leave to caregivers other than parents (for example, “Home for Life” caregivers), and to extend parental leave payments to people in less-regular jobs or who recently changed jobs.
- $42.3 million to increase the parental tax credit (PTC) from $150 a week to $220 a week, and increase the payment period from eight to 10 weeks, from 1 April 2015.
- $155.7 million to help early childhood centres remain affordable and increase participation towards the 98 per cent target.
- $33.2 million in 2014/15 to help vulnerable children, including eight new Children’s Teams to identify and work with at-risk children, screening of people who work with children, and additional resources to support children in care.
- $90 million to provide free GP visits and prescriptions for children aged under 13, starting on 1 July 2015.
(Source: Treasury)
It was perhaps the last item – free healthcare for Under 13s – that took the media, public, and Opposition by surprise. As others have stated, it was a policy lifted straight from the policy pages of Labour, Greens, or Mana.
Other increases in funding included increased funding ($10.4 million) for sexual violence services
Sexual violence services have been critically under-funded since 2012 and many were forced to cut back on staffing as funding dried up in Wellington, Auckland, and elsewhere. It is fairly evident that funding increases for child healthcare, parental leave, and sexual violence services have all been left for 2014.
Which conveniently also happens to be election year.
As far as cynical self-interest goes, these Budget funding-measures are an obvious – if utterly crude – attempt at currying public favour as Election Day bears down on this government.
Why was funding for sexual violence community groups not made available earlier, so that full staffing levels and services for survivors could be maintained? $10.4 million dollars out of a Government revenue of $64.1 billion is not massive by any standard. In fact, it is just a shade under one year’s worth of Ministerial travel, at $11 million.
By comparison, National gave a tax-payer funded bail-out of $30 million to the Rio Tinto aluminium smelter last August – three times what was eventually budgetted for sexual violence services.
Even the $2 million of taxpayer’s money paid by National to a Golf Tournament over the last three years would have assisted these much-needed groups keep their services intact and skilled counsellors employed, until this month’s Budget.
Leaving critical funding till Election Year is tantamount to abusing the victims of sexual violence all over again.
The same could be said of funding free healthcare for Under 13s. If it is a good idea now – why was it not a good idea two years ago?
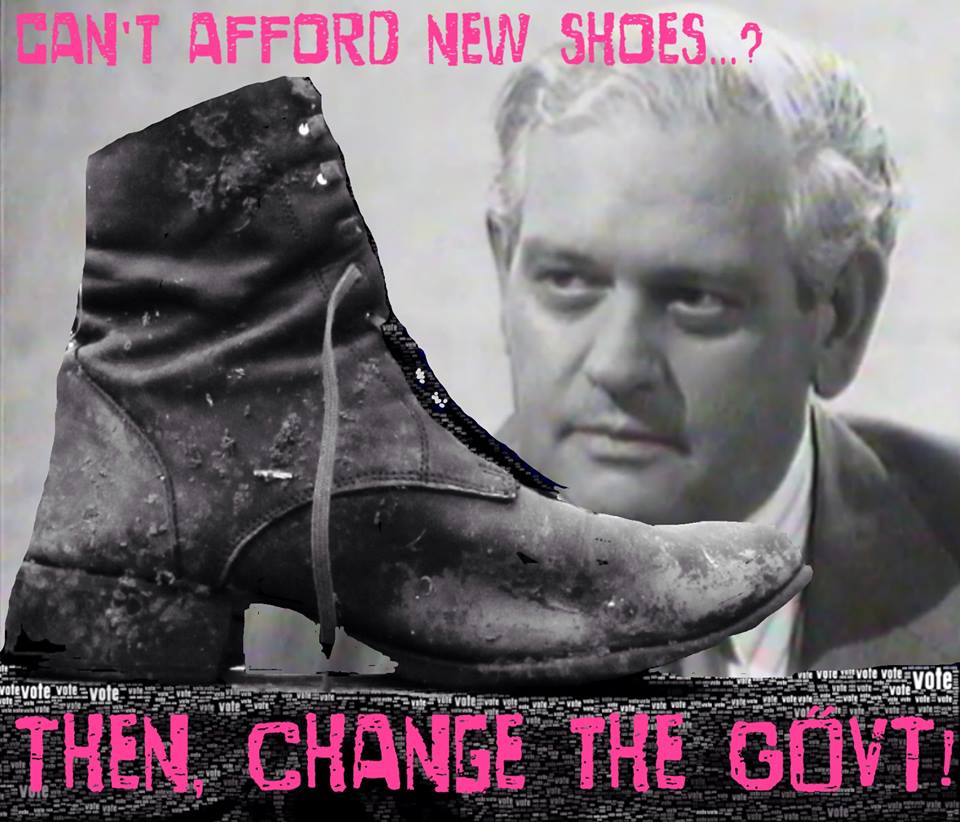
It’s not as if John Key did not acknowledge the growing under-class in this country only three years ago;
.

.
And a year later, this staggering headline appeared in the media – a story few of us would ever believe would happen here, in Gods Own;
.

.
Little wonder then, that Dr Nikki Turner, from the Child Poverty Action Group, was less than impressed by National’s sudden transformation into a quasi-social democratic party with a newly-cloned heart, and a belated attempt to improve children’s health;
A child lobby group says free doctors’ visits and prescriptions will make little difference to reducing child poverty without also improving the incomes and the housing conditions of the very poor.
“Without adequate income, without adequate warmth and housing, we’re not going to (make) a lot of difference at this stage to our children’s health.”
Indeed. Without addressing the core causes of poverty-related diseases, National’s free health-care plan is simply a multi-million dollar band-aid. The root causes of those diseases will still be present in many households up and down the country.
If Key and English thought that their band-aid solutions would be gratefully accepted by an uncritical, compliant media and public, they were mistaken.
An un-named author of an editorial in the Dominion Post on 16 May stated,
“This is a deliberately bland and even boring Budget. The Government has clearly decided that grey and safe is its best hope in election year. The only surprise was free doctors’ visits for under-13-year-olds. Middle New Zealand will welcome it, as it will many of the other, carefully telegraphed, handouts. More paid parental leave: who could object? A bit more help with childcare costs: why not?”
The same editorial went on,
“The other glaring black hole in the Budget is the housing crisis. More and more New Zealanders cannot afford a house, and the Government’s response is muted and inadequate. The Budget promises to remove tariffs on building supplies, a sensible step following revelations about the high price of such materials here compared with Australia. But the change will cut only a few thousand dollars from the price of a house.
Much bolder moves will be needed, including a capital gains tax. But National’s caution here is a drawback, not an advantage. Sometimes problems are serious and need action. National seems to believe it will be enough to cut red tape and remove some of the planning obstacles in the way of housing. It won’t.”
This is where John Key and Bill English have mis-calculated badly, and which no one (?) has picked up.
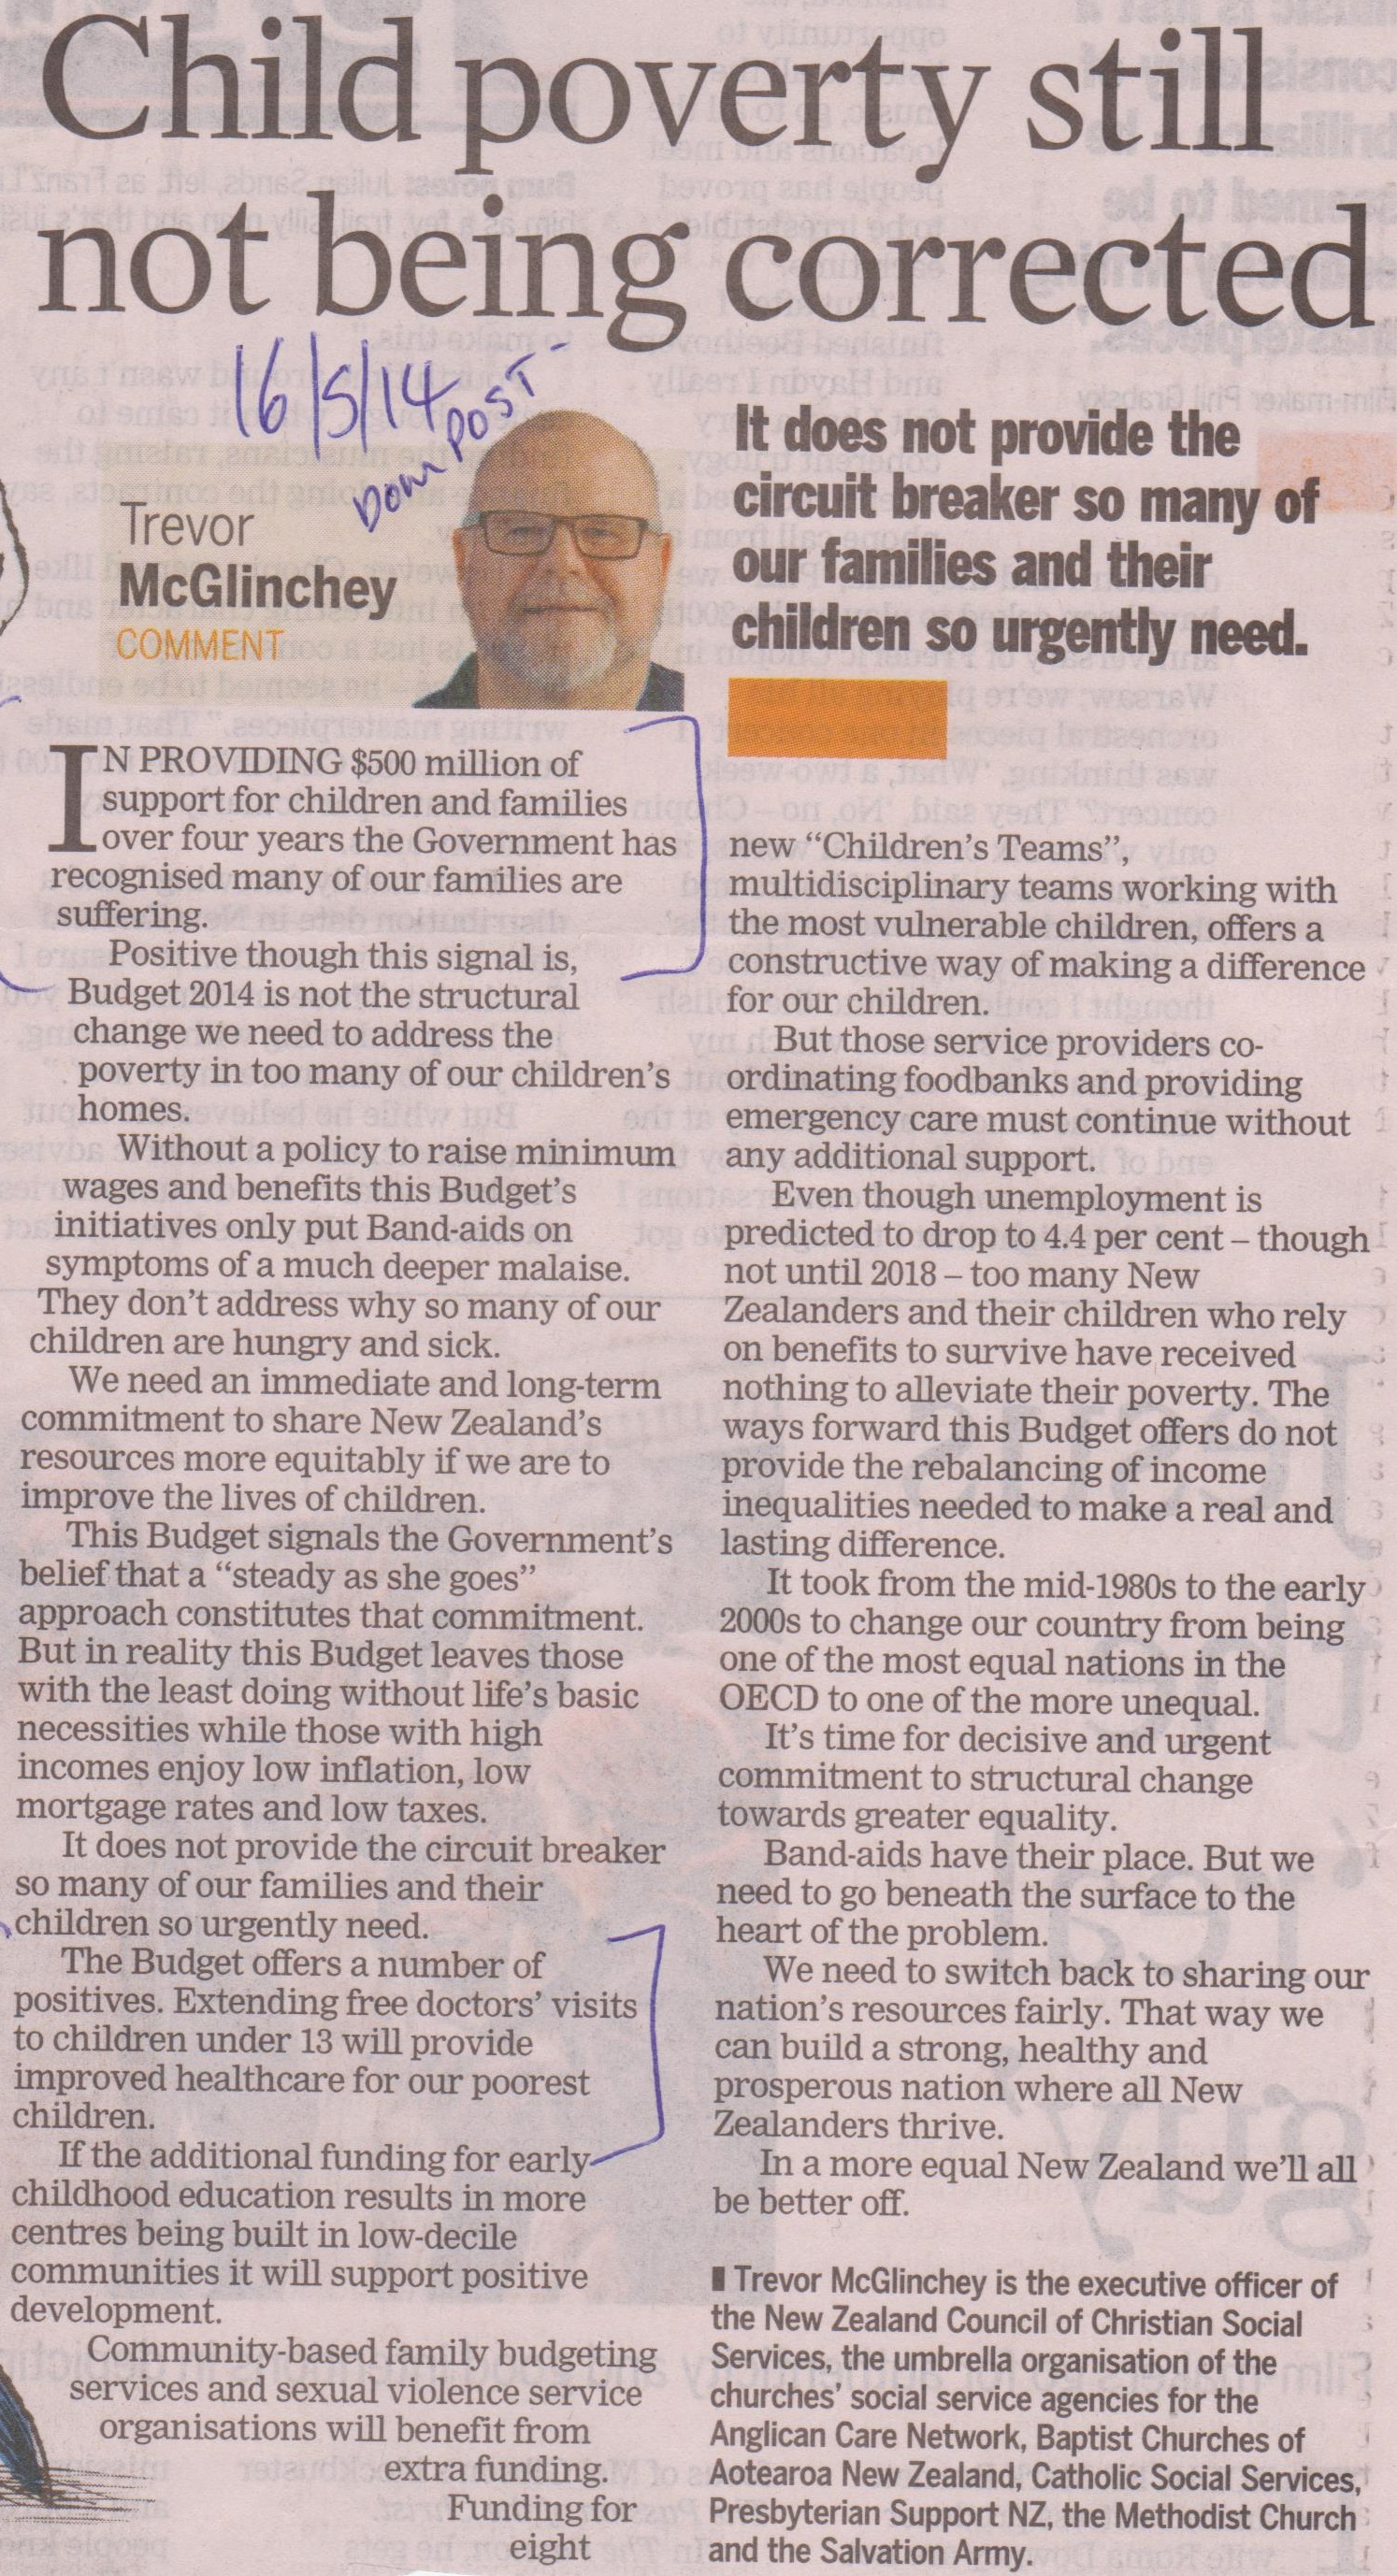
After all, if a problem with children’s health was not critical, why would a fiscally conservative government fund free doctor’s visits to the tune of $90 million? Indeed, as Trevor McGlinchey for the NZ Council of Christian Social Services said, on 16 May,
“In providing $500 million of support for children and families over four years the Government has recognised many of our families are suffering.”
The key-word here is “recognised“.
In funding free healthcare, National has admitted to anyone who will take notice that a problem of some magnitude exists in this country. They can no longer hide behind platitudes.
As the above editorial went on to state,
“At present there is little rage about poverty, inequality and the housing crisis. These problems are raw and real but voters are patient and only a minority of voters now seem to actually hate National. It will probably take another term before a majority is truly fed up with Key and his band. In the meantime, this bland document may be a document for the times.”
The author of that piece is being optimistic. By acknowledging that a problem exists; by acknowledging that state funding is required; and by acknowledging that a “radical” (for National, this is radical stuff) solution is required – they have left themselves wide open in this election campaign.
A campaign manager with a posse of motivated, clued-up, and capable strategists, will be able to use this in the up-coming election campaign. Like a game of chess, in trying to show how “clever” they were in manipulating public perception, National have left their “social policy flank” exposed and vulnerable.
So much for Kiwiblogger Mr Farrar’s misplaced optimism that “I expect debate on the New Zealand Budget to be over by Monday morning”.
Quite the contrary, David.
By shining a bright, $90 million spotlight on this problem, they can no longer deny that it exists or is “improving”.
It’s only just begun.
*
Postscript #1
The cost of financing this country’s $59 billion debt is shown in this Dominion Post graphic;
.

.
The cost of financing our debt is shown to to $3.9 billion, per year.
Two years ago, the Green Party used Parliamentary Library information to estimate the cost of the 2009 and 2010 tax cuts;
“The Green Party has today revealed that the National Government has so far had to borrow an additional $2 billion dollars to fund their 2010 tax cut package for upper income earners.
New information prepared for the Green Party by the Parliamentary Library show that the estimated lost tax revenues from National’s 2010 tax cut package are between $1.6–$2.2 billion. The lost revenue calculation includes company and personal income tax revenues offset by increases in GST.”
The cost of those tax cuts is roughly the equivalent of what we are now paying to service our overall debt.
So much for National’s “prudent fiscal managing” of the government’s books.
Postscript#2
Someone at the Dominion Post seems to have a rather shocking memory. At the bottom of Page A4, in their 16 May edition, this item was published;
.

.
Promised tax-cuts in 2009 were not “axed”. As this IRD page explained;
.

.
Key even made this helpful suggestion to those who did not want their tax cuts to donate them to charity,
“I am just as sure there are many who are in a position to donate some of that extra income”.
Which would make it hard to donate non-existent tax cuts, as the author of the Dominion Post article claimed.
Postscript #3
This graph from Treasury (with a minor enhancement by this blogger) shows our borrowings from 2003 to 2013, with subsequent estimations.
.

.
According to the graph, we can see how Labour paid down the country’s sovereign debt, leaving New Zealand well-placed to weather the on-coming Global Financial Crisis and resulting recession. Something even Key and English have had to admit on occasion;
“The level of public debt in New Zealand was $8 billion when National came into office in 2008. It’s now $53 billion, and it’s forecast to rise to $72 billion in 2016. Without selling minority shares in five companies, it would rise to $78 billion. Our total investment liabilities, which cover both public and private liabilities, are $150 billion – one of the worst in the world because of the high levels of private debt in New Zealand.”
Indeed.
.
References
Dominion Post: English spreads the lolly far and wide
NZ Treasury: Key Facts for Taxpayers (Part 1)
NZ Herald: Budget 2014 – Building products tariffs lifted temporarily
Manawatu Standard: Boost for rape crisis services welcomed
Fairfax media: Rape crisis line forced to cut staff
Dominion Post: Wellington rape centre forced to cut hours
NZ Treasury: Government Revenue
Fairfax media: MPs’ travel costs rise
NZ Herald: PM defends $30m payout to Rio Tinto
NZ Herald: Golf event tots up $2m in Govt aid
NZ Herald: Key admits underclass still growing
Fairfax media: Hungry kids scavenge pig slops
Radio NZ: Child lobby sceptical of budget moves
Dominion Post: Editorial – The crowd goes mild at Budget
Parliament: Inequality—Assets and Income
Scoop media: Govt’s 2010 tax cuts costing $2 billion and counting
Dominion Post: Child poverty still not being corrected
IRD: [2009] Tax cuts for individuals
Otago Daily Times: Key says donate tax cuts to charity
NZ Treasury: Net debt peaks as a share of GDP in 2014/15
National.co.nz: Mixed Ownership
Previous related blogposts
Letter to the Editor: playing politics with rape victims, National-style
Letter to the Editor: $3000 offer to the Unemployed is a joke – and not a very funny one!
Letter to Radio NZ: $3000 offer to the Unemployed is a joke – and not a very funny one (v.2)
.

Above image acknowledgment: Francis Owen/Lurch Left Memes
This blogpost was first published on The Daily Blog on 18 May 2014.
.
.
= fs =
News Archives

Crony Watch

Keeping an eye on dodgy government appointees, crony-by-crony!
